This report has received 103 updates. The last was made on November 1st, 2023
– Documented how Reddit are now dominating results in October
– Updated the number of first-place rankings the top 100 domains achieved
– Three digital goliaths have 36 sites in the top 100 in October, compared to 40 in January
– Confirmed there are still the same number of independent sites in October as there were in January
– Re-ran the entire 10,000 SERP analysis for October of 2023
– Re-ran the entire 10,000 SERP analysis for July of 2023
– Re-ran the entire 10,000 SERP analysis for March of 2023
– Performed a brand new analysis for January of 2023
In an analysis of 10,000 search results populated by sites promoting products as an affiliate, one website has gone from ranking 635th overall in July, to 10th overall in October of 2023.
Three brands control 36 of the top 100 domains overall, and the fifth most popular domain extension was .co, just ahead of .io and .digital.
This is just a teaser for what we really wanted to see: Are ‘general’ sites like Forbes completely taking over, or do single-niche affiliate sites still rank well?
We first performed this analysis for 1,000 keyphrases back in 2019, quickly becoming one of our most popular blog posts ever.
We analysed search results again in March and May of 2021, but this time for 10,000 keyphrases. The insights became a semi-viral Twitter thread (400+ likes), but we never published a full analysis as ~100 keyphrases weren’t up to our standards.
Now in October of 2023 we’re back with our fourth update of the year with more insights than we’ve ever shared before.
Let’s get to the numbers.
The 10,000 Affiliate-Populated Keyphrases We Analysed
It’s easy to put the phrase ‘best 2023’ into your favourite keyword research tool and export the results, but they aren’t always going to return queries where product affiliates are present.
Highly-searched phrases like ‘best careers for 2023’ or ‘best medicare plans 2023’ wouldn’t fit the bill.
For that reason, we had to hand-pick the 10,000 different queries and verify some results were focused on recommending the physical products of others, primarily through affiliate links.
Our finalised list of keyphrases included the likes of:
- Best electric toothbrush
- Gifts for best friends
- Best pregnancy pillow
- Fastest external SSD
- Best portable AC
…and literally 9,995 more.
While picking the phrases manually was a multi-week process, it also meant that we could spread our phrases across different niches.
We didn’t just focus on the tech space but also on beauty, automotive, kids, home and so on.
We required that each keyphrase had at least 400 searches per month in the US, according to Ahrefs.
There’s a supplemental Google Doc to go with this report which goes into more detail on the keywords we chose (and those we ignored) for our findings.
Of the Top 100 Websites Overall, Just 4 Were Independent Brands
Of the top 100 domains ranked by how many search results they appeared in, 96 of them were part of news organisations, public companies or large site networks.
After checking multiple times to verify, we concluded that just 4 of the top 100 websites overall were independent brands.
This is one fewer independent website now in October compared to when we analysed the search results in January.
IAC’s DotdashMeredith had 15 websites in the top 100. Hearst had 12 and Future had 9.
That’s 36 of the top 100 ranking domains owned by just three different companies. And they have many more just outside of the top 100 as well.
Below you can see those 36 sites. You probably recognise a few of them…
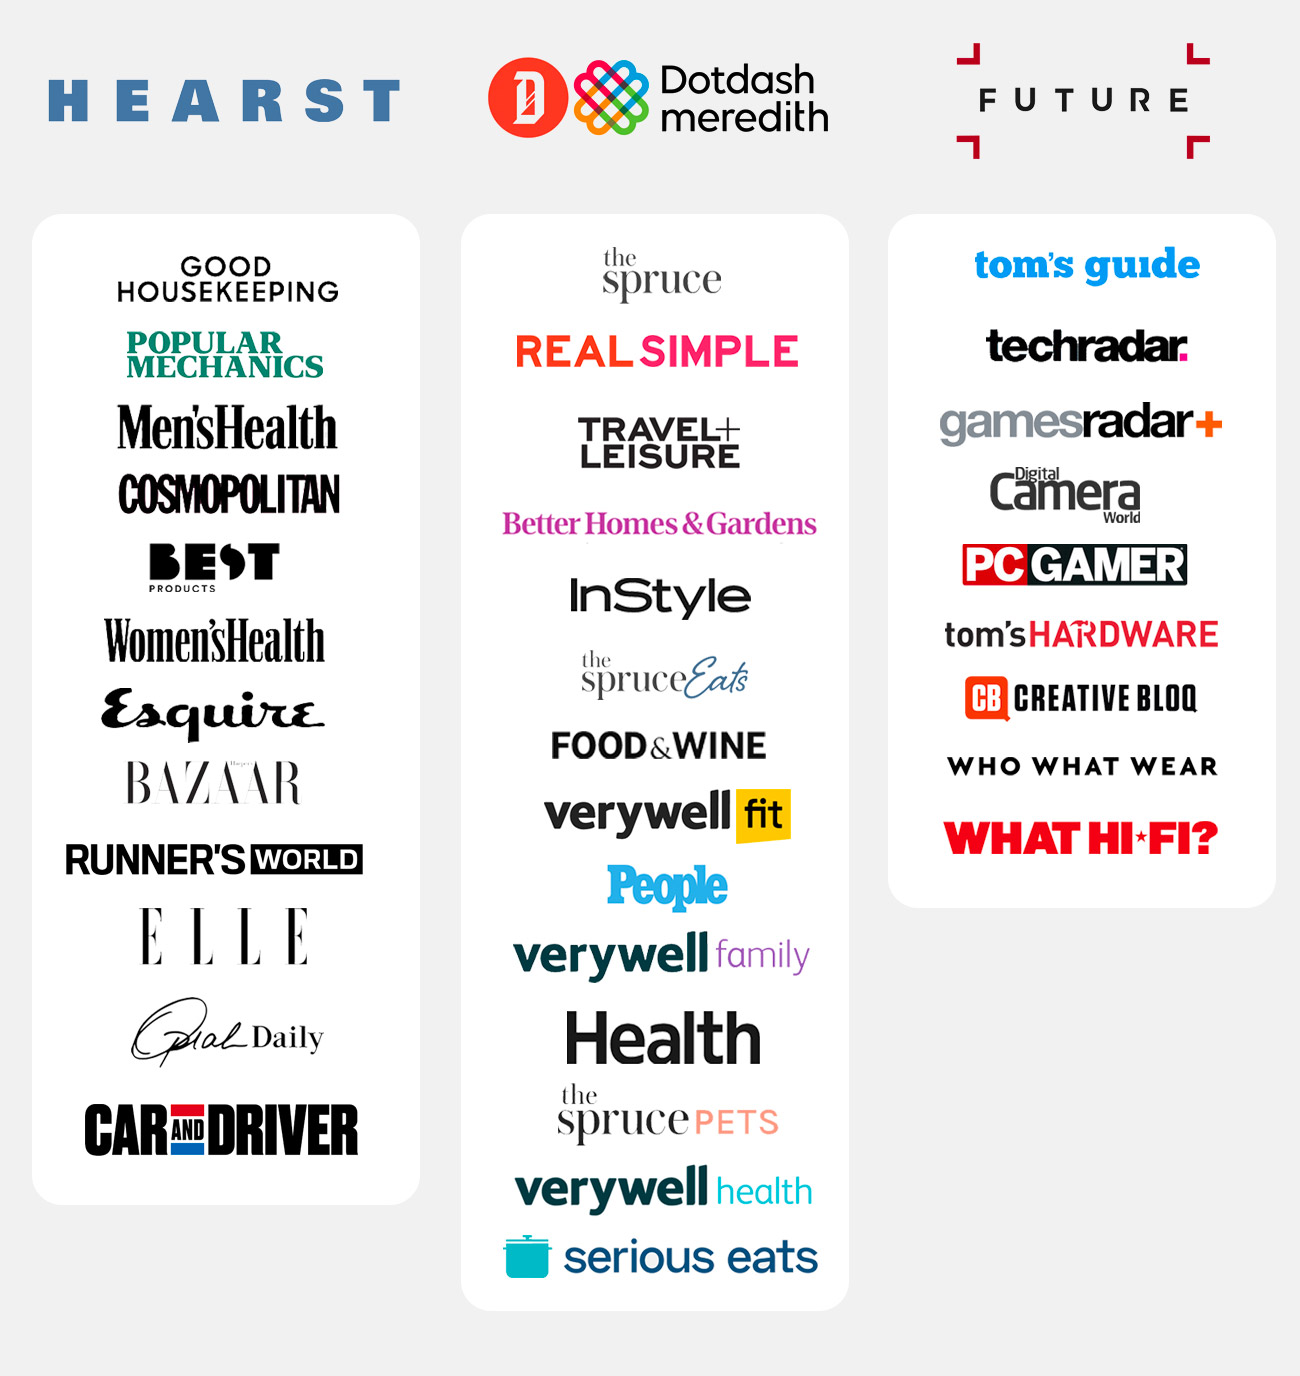 Note: As far as I can tell, Hearst own all of Runner’s World but it’s possible it’s just the magazine and not their website.
For many search results, independent affiliates are nowhere to be found:

The above screenshot is heavily modified in the sense that I removed Ads, the People Also Ask feature, and the Popular Products feature, but I did not change any organic listings or their order.
It might look even worse if I added the Vox Media (NY Mag) and Condé Nast (Glamour) logos, but nothing is worse than me revealing my search history there.
As I discussed in my 16 companies dominating Google article, I have no problem with what these big brands are doing in terms of having multiple sites targeting the same terms. I also don’t think sites shouldn’t rank just because they’re part of a network.
Brands like Elle and Cosmopolitan are probably what people curious about bikini trimmers are looking for.
I think Google still have a lot of improvements to make in these SERPs, but for now I just wanted to give you an idea of the current situation.
I’m working on the 2023 update to that article – it has taken months of work so far – so please subscribe to our newsletter (free) at the end of this post if you don’t want to miss it. I’m planning to launch it in the next few weeks.
The 20 individual domains that appeared most often in the 10,000 search results (in reverse order) were:
 Consumer Reports
 Wired (Condé Nast)
 Byrdie (Dotdash Meredith)
 Tom’s Guide (Future)
 YouTube
 Rtings
 Reviewed.USAToday (Gannett)
 BestBuy
 CNN
CNN TechRadar (Future)
 Quora
Quora PCMag (Ziff Davis)
 The Spruce (Dotdash Meredith)
 NYMag (Vox Media)
 Cnet (Red Ventures)
 Good Housekeeping (Hearst)
 Forbes (Integrated Whale Media)
 Amazon
 NYTimes
 Reddit
It looks like the NYTimes’ acquisition of Wirecutter for $30M back in 2016 has paid off massively, though Reddit and Quora is the real story here.
Reddit Is Now the Most Popular Domain on the Planet for Product Review Queries
And it’s not even close.
You may have seen people discuss how well they’re performing after recent Google updates, but just wait till I share the stats.
Reddit were present in the first ten results for 6,699 search terms (or, 66.9% of them).
To put that in perspective, that’s almost double the number of results as second place (The New York Times, with 3,680).
In January, Reddit ranked 235th by how many search results they appeared in. In July, that was down to 160. Now in October, they’re #1.
Quora, who many people have also reported on, went from 682nd most popular domain in July, to the 10th most popular in October.
Seeing them this dominant was so surprising to me and our developer that we ran the numbers for all 10,000 search results once again just to confirm what we were seeing. That said, they’re not doing as well as things might seem at first glance.
Out of the 6,699 search results they were on the first page of, they only picked up 17 number one rankings.
(For context, The New York Times picked up 955, Forbes had 355, and Good Housekeeping had 361).
Reddit is showing up a ton, but they’re rarely ranking that well.
Similarly, despite Quora showing up in 1,257 search results, they only picked up two (yes, 2) first-place rankings.
I know these numbers are surprising so I shared the data with Cyrus Shepherd from Zyppy just to have some kind of back-up as to what I was seeing.

I want to add here that Cyrus saw the output of the top 500 domains overall, and not the data collection, so if there are any mistakes that is my responsibility. I just wanted someone to be able to say “This doesn’t look fake”, hah.
The Winners in October of 2023 Compared to Previous Reports
I want to make this report valuable but also respect your time, so let’s get make this easy to skim.
The New York Times ranks in 509 more search results and picked up 249 more first-place rankings.
This is comparing the data in October of 2023 to January of 2023. Compared to July, they still appear in 370 additional search results.
Wired is present in 14.6% more search results than they were in July and 27% more than January.
That’s 792 results, compared to 691 in July, and 622 in January.
Forbes appeared in more search results than ever before, and picked up 29% more first place rankings.
In October they were present in 2,381 search results, or 23.8% of them. That’s only 37 more search results than July, but 334 more than January.
Amazon has doubled their first-place rankings, and now appear in 16.6% more search results.
They’ve gone from 95 first-place rankings in January to 195 first-place rankings in October.
They appear in 12.5% more search results compared to January, but 16.6% more if we look at the numbers for March (where they had previously dipped slightly).
There were more new domains ranking than we’ve ever seen.
2,947 that weren’t ranking in July, to be exact.
Less than 3% of these however made it into the top 500 domains overall (which picked up 89% of the #1 rankings).
In other words, lots of new sites are showing up, but they’re not showing very often or ranking very well.
The top 100 domains in our analysis – ranked by how many search results they appeared in – took 7,304 first-place rankings.
That’s 1.1% of the sites, with 73% of the first-place rankings. A 2% increase in October compared to 7,079 first place rankings in January.
The rate drops massively from there, with the next 400 domains only taking up the next ~17% of first-place rankings.
Note: We’re talking about the first organic ranking that appears, which includes Featured Snippets if they were present.
The Most Successful Independent Affiliate Sites That Rank Well
Across the top 500 domains ranked by how many search results they appeared in, 190 were independent brands not connected to any kind of larger network (Future, Red Ventures, Hearst, etc.).
After removing those that were primarily eCommerce stores, news sites or service businesses, we were left with 157 content-focused sites where some articles (often a large %) have a clear goal of making product sales as an affiliate.
Verifying this was a lot of manual work, though it helps that tracking site networks and gaining insights without “outing” anyone is pretty much the promise of our homepage and quarterly reports.
141 of these independent affiliate sites receive more than 100,000 visitors per month from Google, according to estimates from Ahrefs.
47 independent affiliates receive more than 1 million visitors per month from search.
Across the 157 content-focused sites, from the top 500 domains we found, the average number of visitors each received from Google was around 1.3M per month. The median traffic was 427,000 visitors per month (meaning half receive more visitors than that, and half receive fewer).
Just two independent websites passed the 10 million visitors per month from Google mark. I say ‘just’, but I know that’s a ton of traffic.
Two Independent Site Examples from the Top 100 Overall
I don’t think it’s fair to talk about every independent website because I have an SEO-focused audience who are going to want to compete with them.
I say this fully aware you can know how successful a brand is and have an insanely hard time outranking them. It’s no secret how successful NerdWallet are and it’s all on the table now that they’re a public company, but I wouldn’t dream of targeting most of their top terms.
That said, as we get further down the rankings there are definitely some independent sites you could compete with. Not all of them have what could be defined as ‘strong’ domains, and many would surprise you with how well they’re ranking.
Two sites I will mention are Gear Patrol and MindBodyGreen.
Both were one of only 5 independent sites in the top 100 overall, and the reason I’m choosing to mention them is because they’ve publicly talked about their success in the past.

Gear Patrol founder Eric Yang has done interviews with the likes of Digiday and similarly, MindBodyGreen founder Jason Wachbo has done several interviews about his site.
Gear Patrol primarily reviews products like backpacks, watches and motorcycle boots. MindBodyGreen primarily reviews shoes for different occasions, supplements and anything more health-focused.
I’m not going to break down their link building tactics and keyword focus any further than that, just to be respectful.
I should add that even Gear Patrol are not entirely independent, as Hearst purchased a minority stake in them in 2018. That’s how much of a hold just a few brands have on product-focused search results.
Three Independent Affiliates Inside the Top 500 Overall Domains (I Received Permission to Share These)
There seems to be a growing trend of “outing” websites on Twitter for likes & retweets but the truth is, 99 times out of 100 those websites would not want to be mentioned in the SEO world, let alone torn down in the way they are.
And the thread creators are well aware of this.
To reiterate what I said above, there are independent websites ranking well that would make you very confident you could compete with them. I don’t think it’s my place – at least in the context of this article – to mention those cases.
I contacted six websites asking if they’re OK with me mentioning them here, promising I wouldn’t publicly analyse their backlinks, top rankings, or similar. I received three Yes’, two No’s, and one didn’t respond.
Here’s an email from one independent webmaster in the top 500:

And here’s another:

Just to make something clear: I am not perfect here. I’ve mentioned sites in the past that are doing well with SEO that might not have wanted the world to know (especially in front of an SEO-focused audience).
Still, as I’m producing more content here this year than I ever have, I want to up my game when it comes to being respectful.
I’m not going to derail this report but wanted to explain why I’m not just listing out all of the top affiliate sites here. I’m working on some personal guidelines I’ll put up on our behind the scenes section, but let’s get back to the topic at hand.
You already know what a site that has affiliate recommendations on it looks like, but it’s nice to highlight some independent examples from our own research, so thanks to the three sites below for allowing me to share them.
Example #1:  LivingCozy

LivingCozy is focused on helping you discover the best home and furniture brands, ran by someone I consider a friend, Ash Read.
The site was founded after Ash moved house in 2019 and struggled to find furniture to match his tastes in the absolute sea of options online.
Those in the internet marketing world may recognise him as the previous head of content at Buffer.
Example #2:  Smoked BBQ Source

Being a barbecue fanatic himself, SmokedBBQSource founder Joe Clements created the website to document his journey learning more about grilling and smoking meat.
SBS is primarily a blog-style website, but having their own online store and dedicated YouTube channel shows they’re smart about diversifying their focus (and it’s a passionate subject for them).
Example #3:  Retro Dodo

I’m not just saying this because Retro Dodo’s founder gave me permission to talk about the site, but it’s the kind of website I would want to rank if I had a search engine.
Founder Brandon Saltalamacchia is clearly all-in on the topic of retro handheld gaming. They’ve even published a physical book on the topic, and are working on another.
Google Ranked Just 8,833 Domains Across 10,000 Search Results
(And We Manually Categorised Every Single One)
For the January 2023 version of this analysis we found 8,833 individual domains ranking.
In October of 2023 we found 8,866 domains ranking.
That’s down from 11,042 domains ranking in March of 2021, and 10,955 domains ranking in May of 2021.
That’s a 19.3% decrease in the number of individual sites across all top 10 search results.
It’s important to note that we didn’t check the exact same keywords as in 2021, but we did check the same number of search results.
These results also contained 4,985 domains we’ve never seen (or categorised) before. That was more than double what we expected.
We analysed the 10,000 search results over 48 hours, from the 13th of January to the 15th of January, 2023. Crucially, we took our SERP snapshot after December’s helpful content and link spam updates had finished rolling out.
This could probably be improved in future updates, but our categorisation was as follows:
- General reviews site (such as BestProducts)
- Niche affiliate site (such as The Spruce)
- Hyperniche affiliate site (such as PowerBankReviews.com – not a real site)
- Niche news (such as MacRumors)
- General eCommerce site (such as BestBuy or Walmart)
- News site (such as The Guardian or Wall Street Journal)
- Niche service (such as a landscaping company that happens to have affiliate-focused blog posts)
- Forum (such as Reddit or Quora)
- Social Media (such as Twitter)
- Encyclopedia (such as Britannica or Wikipedia)
- SEO Agency (one in particular is well known amongst affiliate SEOs)
- Design agency
- YouTube
- App Store
- Crowdfunding site
Something I should be honest about upfront is that our definitions will never be perfect.
In some cases we had to make a tough call.
For example, a large section of NYMag is entirely product-focused whereas the rest of the website covers news. A similar comment could be made about Business Insider.
We defined them as news sites since that’s what they produce the most of and what they’re known for, though I accept not everyone would agree.
The primary focus of our analysis was on general review sites vs. niche affiliate sites vs. hyperniche affiliate sites, so let’s define those in a little more detail.
A general reviews site is a site focused on reviewing products but covers a broad range of niches from fashion and beauty to kitchen and car products. BestProducts would be a great example.
A niche site is a site that covers a lot of products in a particular space (such as automotive) but not only one specific item, like tires. TechRadar would be a good example in the tech space.
A hyperniche site covers a tighter scope of products, so they might only review running shoes, or might only review power washers or chainsaws, with few exceptions.
Sometimes it was tough to define a site but as we were looking for insights for ourselves, we made sure we were at least consistent.
Affiliate SERP Analysis: The Results
Let’s start with how many times each type of site was present in the first 10 results of an affiliate-populated SERP.
The winner was clearly niche sites, with niche news sites not too far behind.
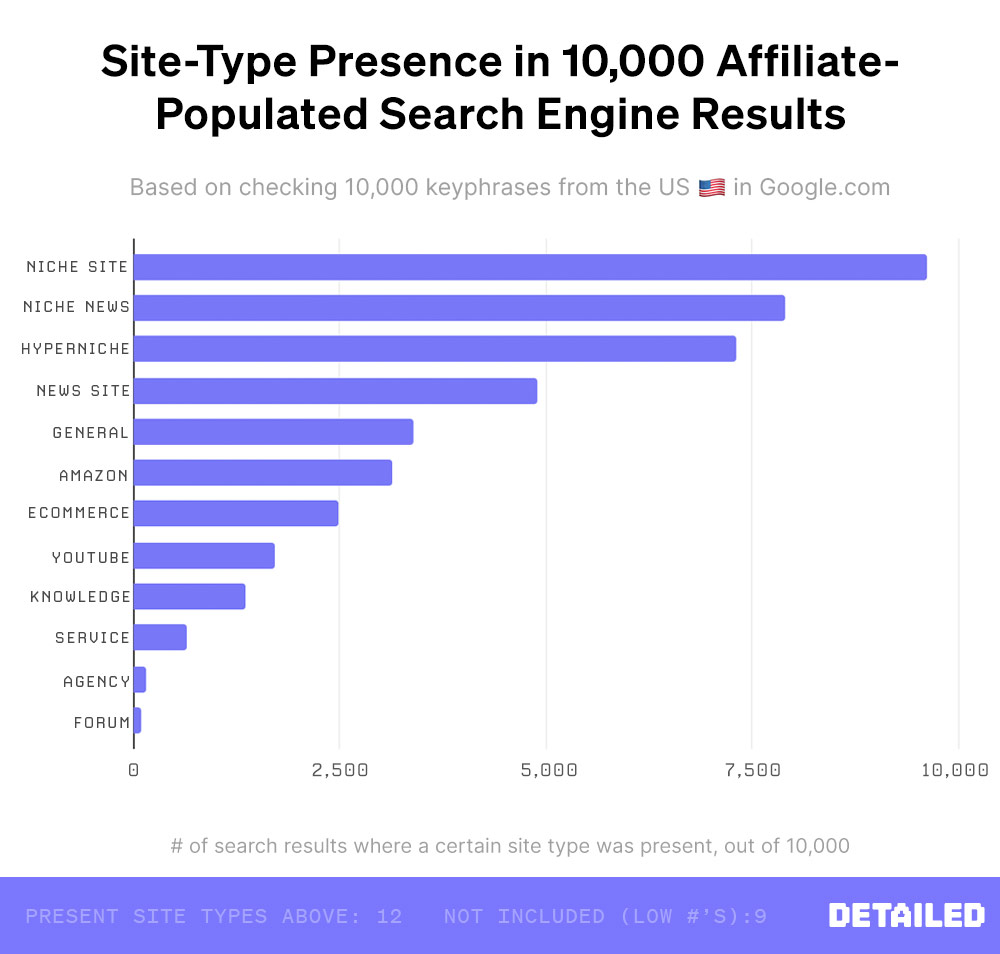
Note: Some site types had numbers too low to show on the graph above, but were present in at least one SERP, such as App Store results, PDFs and Job boards.
One clear change we’ve noticed in 2023 is that sites which primarily monetise with product reviews are now far more prone to supplementing their websites with news updates and informative guides than they were with our first report in 2019.
Four years ago it was much easier to quickly say, “This is a site built to make money as an affiliate”. Nowadays that intent may still be the case, but you might not see a single product review on a sites’ homepage to help you come to that conclusion.
In other words, categorisation is far harder than before, so while we have done our best to be accurate, I can’t claim we are perfect here.
One nice surprise was to see niche news sites doing so well. Active news sites do tend to pick up a lot of links naturally which doesn’t hurt.
💡 Let me clearly explain niche news, just so there’s no confusion here.
One site we found ranking covers football news (I’m English so it’s illegal to type soccer). Multiple times per day they share transfer updates, commentary about upcoming fixtures and interviews with players.
On occasion they also happen to review things like the best football boots for kids of certain ages.
It’s not technically right to call them a product review site because that’s less than 1% of the content they’re producing.
Lots of niche news sites review products as an additional revenue stream and sometimes they rank really well.
Since only around ten sites we categorised as niche news are focused on a very specific topic (e.g. hyperniche) you could combine all ‘niche news’ stats with ‘niche affiliate’ if you really wanted to.
We’ve seen how present each site type is, but who actually ranks well?
Here’s the numbers for first-place organic rankings by site-type. Note that this also includes featured snippets if one is present (which they were for 13% of queries).
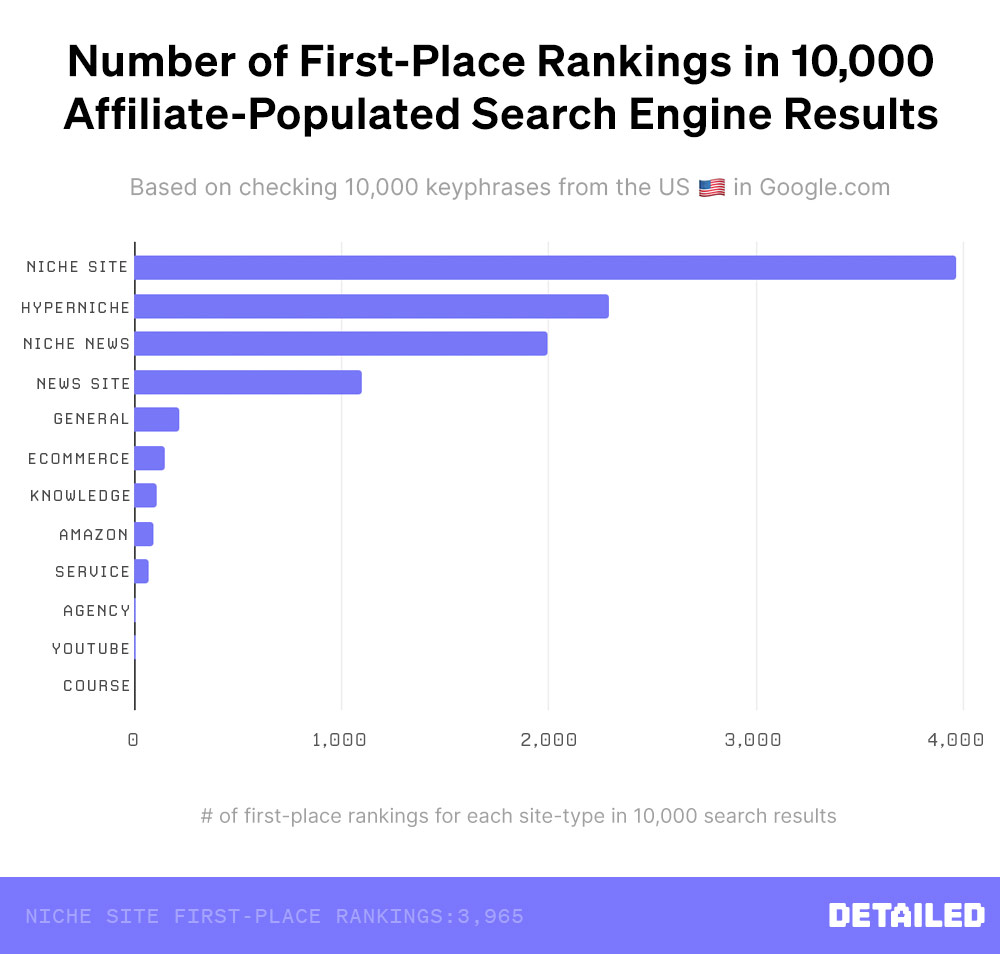
Niche news sites might be present in more search results than hyperniche sites, but hyperniche sites took more first-place rankings.
Non-Amazon eCommerce sites appeared in fewer search results than Amazon but took more first place rankings than them.
Featured snippets were present in 1,356 of our 10,000 search results pages, so let’s break those down separately. Who is actually doing well taking one of these coveted search features?

Once again, despite being present in fewer search results than niche news sites, hyperniche sites were more likely to take the featured snippet.
What Does This Mean for You Building a Product Review Site?
Does it mean if you want to stand the best chance of ranking with an affiliate site, you should build a niche-focused or hyperniche-focused brand?
Possibly.
There’s a lot more to succeeding online than just the niche that you choose.
That said, our admittedly simplistic viewpoint does suggest having some kind of niche element to your affiliate review website will help you rank more often, and higher, than a general review site or general news site.
Even more so when you consider that theoretically, general review sites had a higher chance of appearing in our tests as they cover a broader variety of search terms, though there are very likely fewer of them across the web as a whole.
Some people reading this might even be tempted to start a news site, but news sites are historically one of the toughest spaces to make consistent profits. Deciding to start a news site to rank for product reviews down the line is definitely getting your priorities wrong.
Create a news site because you’re deeply passionate about covering news in your industry and could see yourself doing it many years from now.
I know it’s boring to read but passion, consistency and budget are far more important no matter which approach you take.
As I said back in our 2019 report, consider this analysis as a mission of professional curiosity, rather than a recommended direction you should follow.
Finally, keep in mind that a large part of doing this analysis is so we can monitor Google algorithm updates going forward and whether certain site types win out at scale.
If Google makes another product review focused update (which they likely will) we have a great base now to make comparisons.
Can New Affiliate Sites Rank Quickly? We’ve Got the Data…
In our analysis which brought back 8,883 individual websites, at least 450 of them (5%) were less than two years old.
I say at least because our count is solely based on domains that were registered for the first time in the last two years, and domains that were dropped and then reregistered.
This means that we miss sites where someone had been sitting on a domain for a while and only just recently built out a site on it.
In other words, it’s fair to say that more than 450 sites were under two years old in terms of how long they’ve been actively worked on.
The youngest ranking domain overall was just 31 days old.
It might seem inspiring that you can rank a website a month after registering the domain, but can you pick up any kind of decent traction?
That 31-day-old domain currently receives an estimated 13,800 visitors per month from Google, according to Ahrefs.
Across every domain that ranked on the first page of a search result, our analysis found exactly 100 domains that were registered in the past year.
Out of those, the highest-trafficked site reached 842,000 monthly visitors, with the average count at 26,428 monthly visitors.
These numbers are all estimates provided by Ahrefs (homepage link).
Let’s chart the traffic for all one hundred domains (pretty amazing it was exactly one hundred) registered in the past 12 months.
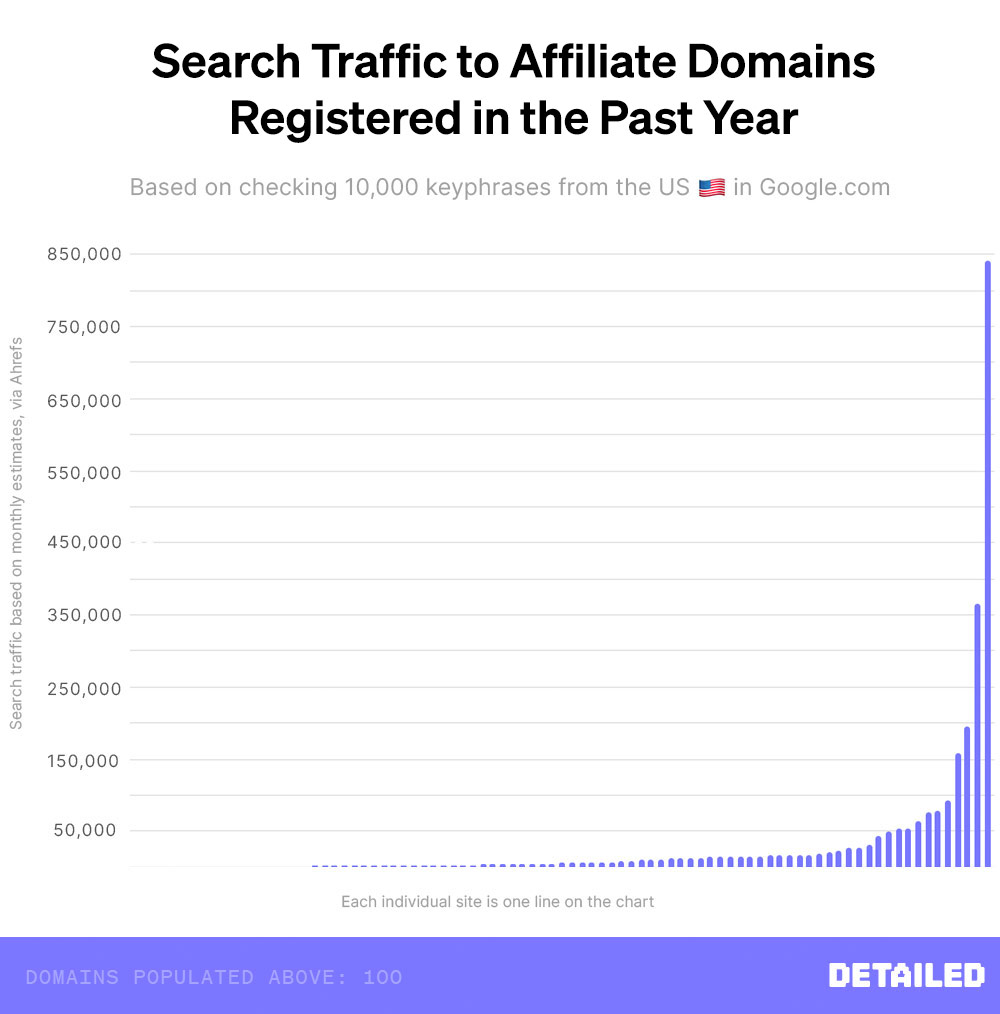
The vast majority of newly registered domains reach fewer than 50,000 visitors per month, even when they rank on the first page for at least one term. Some sites receive so little traffic that you can’t even see their lines at the start of the chart (I promise they’re being counted).
There are some really impressive figures towards the right, but…
As Some of You Will Have Guessed, There’s a Twist in the Story
How does a 31-day-old website pass 10,000+ monthly visitors from Google?
You take another website that’s ranking and / or has links and redirect it there.
The site getting 842,000 monthly visitors from Google in less than a year? That’s also the product of redirects.
Instead, here are the top 10 domains and the niche they’re in – registered in the past year – that (from what I can tell) did not rely on any kind of redirect to get their results.
- 🎾 Sport: 365,000 monthly visitors from Google
- 🏝 Travel: 196,000 monthly visitors from Google
- 💻 Remote work: 53,000 monthly visitors from Google
- 🐟 Fishing: 43,300 monthly visitors from Google
- 💍 Jewelry: 30,800 monthly visitors from Google
- 🏝 Travel: 27,100 monthly visitors from Google
- 🏐 Volleyball: 22,700 monthly visitors from Google
- 🕹 Gaming: 18,300 monthly visitors from Google
- 💰 Finance: 17,400 monthly visitors from Google
- 🐶 Dogs: 17,400 monthly visitors from Google
These numbers aren’t that impressive for the best of the best new sites…
…and I’m about to make them look even worse.
The number one site on this list is part of a very successful, very established brand. After a quick analysis it appears they took years of offline content and put it all on their website at once — it’s pretty odd as there’s no hint of Ahrefs stats or Archive.org saves until 2022, but they have content tagged as much older than that.
They also have established connections with some of the biggest names in their industry (think: A music blogger getting to interview Beyonce and the links that might pick up) which makes their success insanely hard to replicate.
The second site on the list is primarily targeting French speakers, with France being where the majority of their traffic is coming from, and site #9 is primarily written in Spanish and appears to be using scraped content from other sites.
While there will be some new sites doing well that I wasn’t able to identify (because they weren’t using a brand new or dropped domain), it looks like it’s incredibly rare to receive a lot of traffic in product search results quickly.
Literally the best example I could find after looking at ten thousand search results, where I think you have a chance of replicating their same less-than-a-year success, gets 53,000 visitors per month from Google.
It’s a respectable and even impressive number based on their competitors, but I think this is less than what most people would assume is possible.
Of course, I hope this doesn’t deter anyone from starting a site that reviews products or services. You can still rank for some terms quickly — I just wouldn’t quit your job expecting to see huge numbers in your first year.
This SEO thing takes time.
One Website Received an Incredible Domain Upgrade After 48 Hours
Around 48 hours after we collected data from search results, one website received a nice domain upgrade.
AllAboutCats.com became Cats.com.

I couldn’t find anyone reporting this – nor any kind of press release – but as far as I can tell the website has the same owner; just a nicer domain.
Founder Doron Woffberg has been on domaining podcasts and shared website acquisition case studies in the past so he’s no stranger to sharing his internet marketing success.
I had nothing more to add than saying I thought this was pretty cool.
Good luck with the rebrand, Doron. As someone who likes keyword .com’s (many of you know we also run Gaps.com which is currently being redesigned), I’m pretty jealous.
A Public Company Also Went Live With a Surprising Redirect
If you’re subscribed to the Detailed newsletter (homepage link) you’ll know that one affiliate site I enjoy watching is Reviewed.com.
They’re owned by a public company (Gannett) and have a few quirky elements about their design that I refer to as ‘Superpixels’.
As we were putting together this article I noticed that they’ve now redirected their entire domain to a subdomain on USAToday.

The subdomain vs subfolder debate is one of the most discussed topics in SEO, but more often than not you’ll see a traffic increase from moving content from a subdomain to a subdirectory.
It’s interesting that they’ve basically done the opposite.
(There are lots of variables here, so please don’t just take the above sentence as something you should do, or have to do, yourself.)
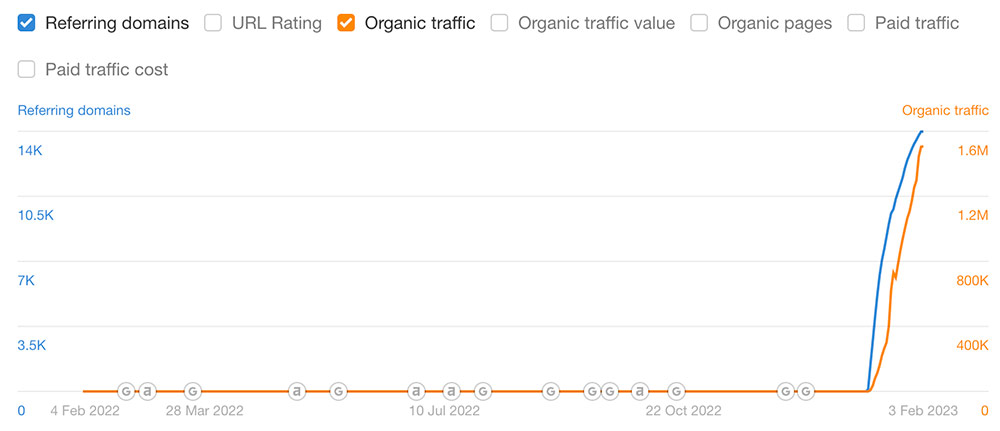
I would love to know their internal motivations for making a move like this. A subfolder on USAToday would have made a bit more sense, but this feels odd.
And it’s not like they’re trying to free up the Reviewed domain (surely?) because they’re going to be relying on the redirect for all those links it has.
NYTimes’ Wirecutter Just Had Its Best Quarter…Ever
Purchased back in 2016 for $30M, it took a few years before they moved the Wirecutter website to a subfolder at nytimes.com/wirecutter/.
As the New York Times are a public company I often read their earnings reports, and they just said something pretty interesting about Wirecutter.
Our fourth quarter results also underscore the power and benefit of having diverse sources of revenue even beyond subscriptions and advertising, as we enjoyed a record quarter for affiliate revenue to Wirecutter, driven by a highly successful holiday shopping season.
This is literally a quote from now (February of 2023).
They mentioned it being part of their ‘Other revenue’ which came out to be $72M, but unfortunately didn’t say how much of that was from Wirecutter.
Did You Know Yahoo Owns a Product Review Brand?
Launched by Verizon in February of 2020, In the Know primarily covers entertainment trends and beauty product updates, but they also have pages covering things like the most affordable knife sets on Amazon (pictured below).
Just a few months after its launch, Verizon seemingly sold the site along with Yahoo and AOL to Apollo Global Management.

As you can see from the logo, they make no secret that this is a Yahoo property.
It’s not prolific in terms of ranking for review terms, as Ahrefs reports they “only” rank for 2,384 keywords with ‘review’ in them (in the US 🇺🇸).
Still, a lot of their product recommendation pieces don’t tend to use review keywords in them, as you can see from the headline in the screenshot above.
The Presence of Amazon
It wouldn’t be accurate to say that all of the sites we analysed were pointing their affiliate links to Amazon, but the vast majority of them certainly were.
Amazon, as you may know, actually “competes” with their affiliates, as they have their own guides and category pages on what the best products of a particular type are.

Because of that, we thought it would be insightful to see how well Amazon saturate product review search results.
Here’s the chart that could have been a sentence but I appreciate skim readers being here as well.
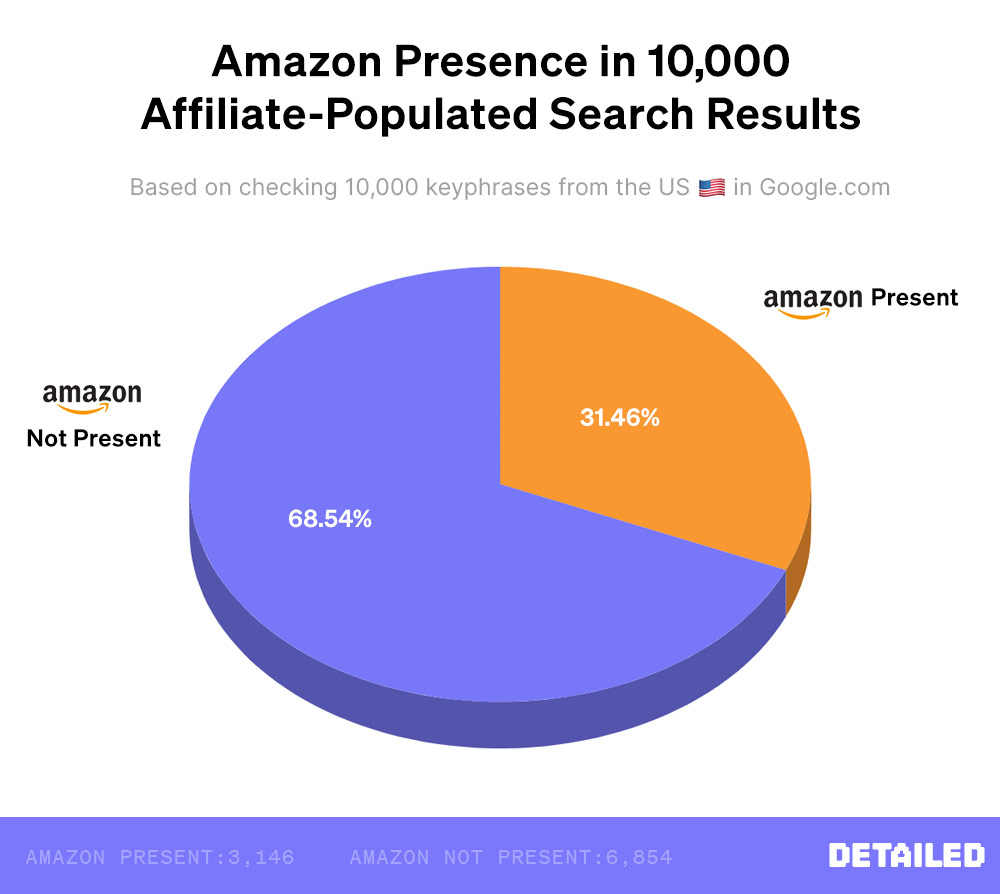
In 10,000 individual keyphrases analysed, Amazon ranked on the first page of search results for 3,146 (31.4%) of them.
I don’t know about you, but that number is higher than I expected.
Though they might not be as dominant as they first appear. Out of those 3,146 first-page rankings, Amazon achieved:
- 95 first place rankings
- 178 second place rankings
- 243 third place rankings
In other words, when Amazon was present on the first page of rankings, it secured a number one ranking just 3% of the time.
It secured a number two ranking 5.6% of the time, and a third place ranking 7.7% of the time.
Those numbers drop to 0.95%, 1.78% and 2.43% respectively when you ignore whether Amazon was present or not.
As we plan to monitor the same keyphrases going forward, Amazon’s growth or decline in these search results should be one of the most interesting things to keep track of.
The Backlink Score (Ahrefs Domain Rating) of the Top 500 Domains
Domain Rating, an Ahrefs metric, is essentially their own scoring of the quality of backlinks to a website on a scale of 0-100.
Out of the 500 domains which appeared in the most search results, the average Domain Rating (DR) was 78.
For some context, eCommerce giant Amazon has a DR of 96 and some SEO blog you may know called Detailed has a DR of 71.
We can chart DR and a website’s place in our top 500 rankings but it’s really not the best chart to make. After all, we’re ranking domains by how many search results they appeared in, and some websites might have simply covered more topics than other sites so they appear higher, but have “weaker” domains.
Just keep that in mind before reading too much into the following graph:
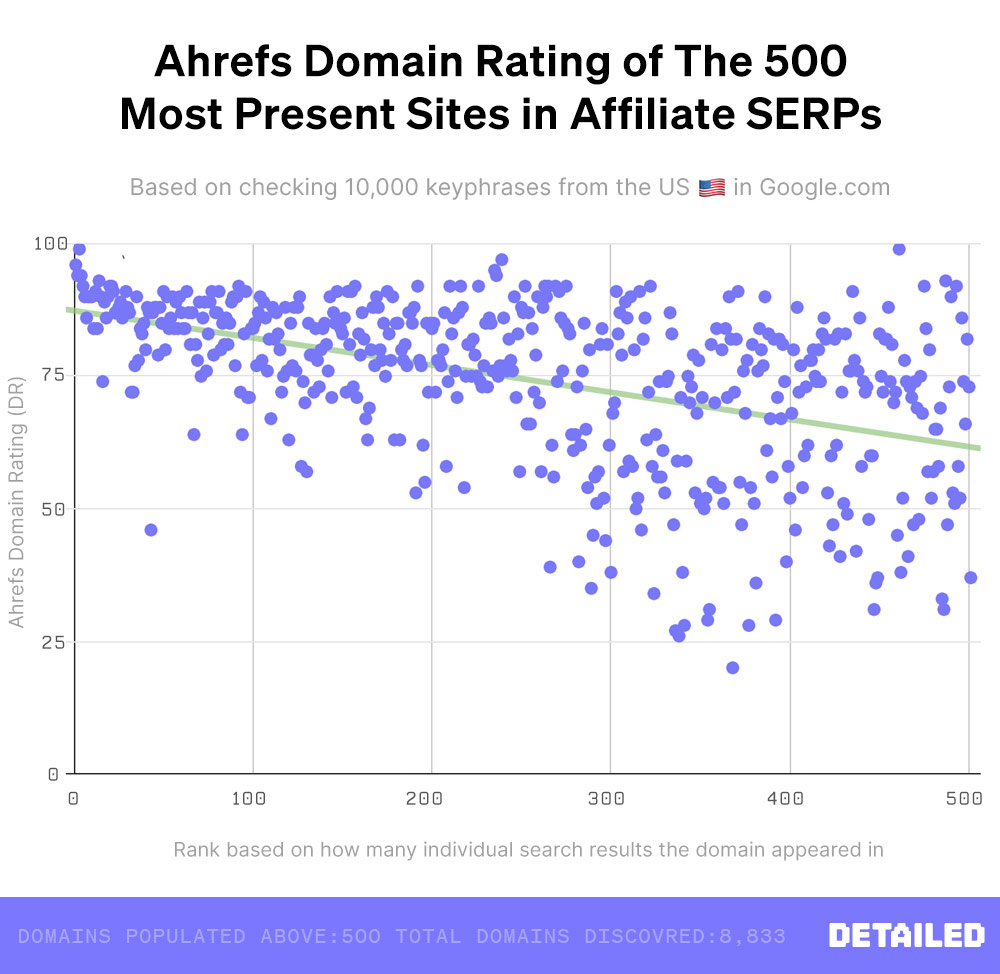
What I was more curious about is whether there were any domains that Ahrefs class as low quality (or, at least, give a low Domain Rating) but still rank well and get a lot of search traffic.
The lowest-rated domain in our top 500 domains overall has a DR of just 20. Ahrefs estimates it reaches 105,000 people each month from search.
They primarily review a particular type of PC hardware and it looks like a great resource with real people behind it, but that’s all I’ll say here (there’s an additional report coming mentioned at the end of this article).
Of the 42 sites which had a Domain Rating of 50 or less, the one with the most traffic is estimated to reach 1.9 million (!) people from Google each month.
It’s in the fitness niche, but I don’t think it’s fair to mention the URL.
There were more sites in the 81-90 DR range than any other ‘block of 10’ results. Meaning, more 81-90 DR sites than 71-80 or even 61-70 DR sites.
It shouldn’t be surprising but – at least according to Ahrefs metrics – the vast majority of affiliate sites ranking well have backlink profiles they rate highly.
The Top 500 Domains and # Of Referring Domains
Referring Domains refers to how many individual websites currently link to one of our top 500 domains. Referring Domains is not an Ahrefs metric, but we are using Ahrefs to determine the count.
The site with the most referring domains was YouTube, with over 7 million.
Once again I can chart Referring Domains compared to a websites’ position in our top 500 domains but it’s not the smartest comparison to make. As we’re ranking sites by how many search results they appeared in, some sites cover more topics than others so it’s not a fair analysis.
Note that YouTube was removed to give more granular detail to sites lower on the chart.
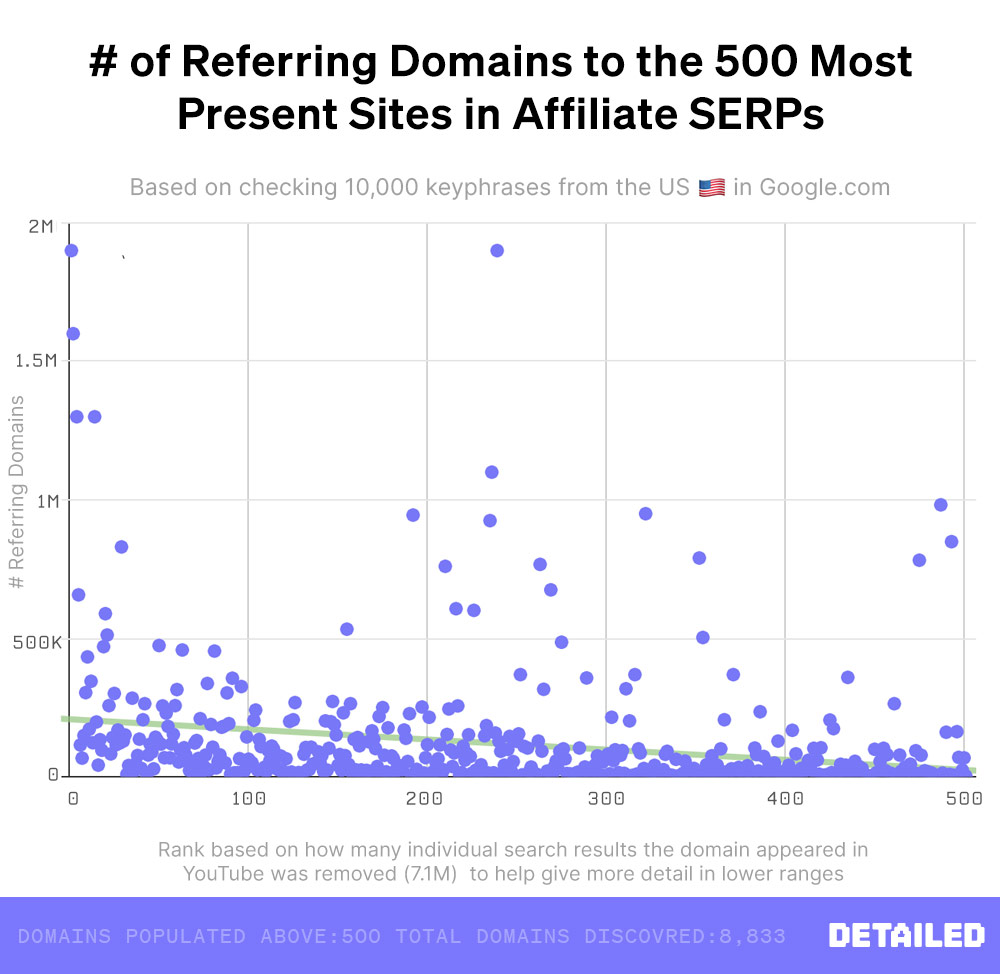
The real reason I actually wanted to check this was to see if any low authority domains stood out.
The site with the least referring domains has links from 717 sites and a DR of 33. Ahrefs estimates it currently picks up around 176,000 visitors per month from Google.
It’s a site in the BBQ niche.
Just four websites had fewer than 1,000 other websites currently linking to them.
Should You Try to Rank Your Homepage or an Internal Page?
It should be no surprise that internal pages are far more likely to rank than a homepage for a popular keyphrase.
After all, a website can have an unlimited number of internal pages, but only one homepage.
Still, I thought it would be fascinating to look at homepages as a whole, to see if anything stood out.
Overall, a homepage ranked on the first page of Google in 303 individual SERPs (3% of the total).
A homepage ranked first 31 times, second 26 times and third 23 times.
Overall, for the most part, it looks like it makes more sense to try to optimise an individual page to rank for a specific keyphrase, rather than your homepage.
The Most Popular Domain Extensions: Just How Dominant is Dot Com?
As someone who has owned more domain names than I would like to admit, I couldn’t look at this data without being curious about which extensions were the most common.
Here’s the numbers:
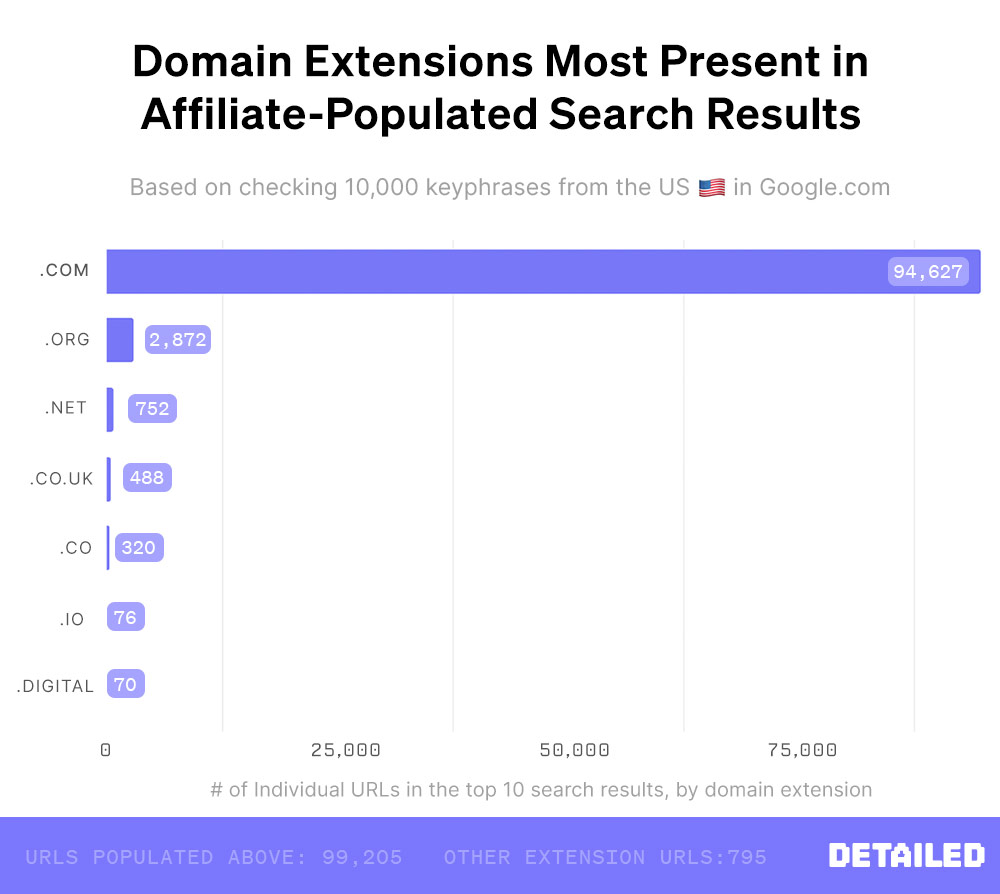
Other extensions we came across, ranked by their number of placements, include:
- .au – present 61 times
- .edu – present 56 times
- .ca – present 45 times
- .gov – present 41 times
- .tv – present 40 times
- .guide – present 36 times
- .us – present 32 times
- .me – present 30 times
- .ai – present 29 times
- .care – present 29 times
- .cc – present 28 times
- .in – present 25 times
- .ly – present 25 times
I can keep going but the entire list is enormous. There were 31 extensions alone which had just one listing (.ninja, .store, .studio, etc.).
How Many Exact Match Domains Are Ranking
Our research found just 24 exact match domains ranking across 10,000 search results for 2023.
An exact match domain would be something like BestBudgetMicrowave.com or FastestExternalSSD.net (we allowed for any domain extension).
When we ran the numbers way back in 2019, looking at just 1,000 search results, only 4 exact match domains were ranking.
So the number of search results has increased by 10X, but the number of exact match domains only increased by 6X.
These numbers are far too small to say anything conclusive, but I still thought it was interesting.
Exact match domains took the number one spot in just 12 of 10,000 search results. They ranked 2nd once, and 3rd three times.
In my opinion, only a single one of the 24 exact match domains ranking is brandable. Maybe four if I’m pushing it (they were pretty short).
The rest just sound spammy and look like they were chosen in the hope of getting some nicely targeted anchor text backlinks.
A Personal Ending to Wrap Things Up (You Can Skip This Section)
If you read the Detailed newsletter then you’ll know that I’m putting my all into content here for 2023. This year we’ve already gone live with a $3.8M affiliate success story, a list of the world’s most successful blogs and a huge (100+ hours) update to our guide to the SEO industry and how much money companies are making.
I like to think this report was the best update from us yet, and I hope you agree, but there is lots more on the way.
I’ve been writing about SEO for over 17 years now and I couldn’t do that if I didn’t love this topic. If I can financially support this free research with more insights on a private offering then I get to help people who are just getting started and those who already have a website and want to take things to the next level.
With that said, members of SEO Blueprint (literally the only thing I sell on this website) get exclusive reports based on more insights I had from the independent affiliate sites ranking well.
I don’t “out” any of the sites but I don’t need to. Our team spent dozens of hours on this and some of the things we found have never been shared elsewhere (at least to our knowledge).
It’s also set up so that I can update it every year with what’s working right now. We’ve been adding to SEO Blueprint for over 4 years now, and every member gets free updates for life.
There’s a waiting list on that link so there’s nothing you can buy right now. This is just a heads-up.
Alright, there’s my pitch over with. ✓
If you’re not already on the Detailed newsletter (there are two opt-in forms below) then it would be great to have you. I respond to every message and only send emails when I have something worth emailing you about.
Thank you so much for being here. I really hope you got a lot of value out of this.
– G


 568
568 
 is our own fully fledged SEO framework and private community focused on taking search engine rankings to the next level.

